The Victoria Real Estate Board has released their latest statistics for the month of October. The following is an excerpt from their press release.
A total of 745 properties sold in the Victoria Real Estate Board region this October, 24.7 per cent fewer than the 990 properties sold in October 2020 and 2.1 per cent fewer than the previous month of September. Condominium sales were down 18.1 per cent from October 2020 with 249 units sold. 18.6 per cent fewer condominiums sold in October 2021 than in the previous month of September. Sales of single family homes were down 30.4 per cent from October 2020 with 339 sold. 2.4 per cent more single family homes sold in October 2021 than in the previous month of September.
"Once again – it’s anyone’s guess what our sales numbers would be like had we been in a market with a historically average number of homes for sale," said Victoria Real Estate Board President David Langlois. "Over the previous ten years, the average number of properties for sale in the month of October was 3,210 - we are one third of that this year. We continue to see record breaking low levels of homes for sale and with continuing competition for homes, we see pricing pressure persist.”
There were 1,036 active listings for sale on the Victoria Real Estate Board Multiple Listing Service® at the end of October 2021, 51.2 per cent fewer properties than the 2,122 available at the end of October 2020 and 7.8 per cent fewer properties than the 1,124 active listings for sale at the end of September 2021.
The Multiple Listing Service® Home Price Index benchmark value for a single family home in the Victoria Core in October 2020 was $880,500. The benchmark value for the same home in October 2021 increased by 25.3 per cent to $1,103,600, a 0.3 per cent increase from the previous month of September. The MLS® HPI benchmark value for a condominium in the Victoria Core in October 2020 was $482,200, while the benchmark value for the same condominium in October 2021 increased by 14.4 per cent to $551,800.
“The only solution to our current market is to create more supply,'' added President Langlois. "And creating supply isn’t something that happens overnight, so we need to make a commitment to build in the coming years. That takes cooperation. It takes public acceptance of increased density in some areas, the ability for builders to staff and supply their developments and for investors to be able to make their plans a reality within a reasonable timeline and at a reasonable cost. We need to continue to focus on densification of our urban areas – the idea of encouraging duplexes and small plexes in neighbourhoods and building up in core areas. Thoughtful densification will allow us to protect our greenspace, leverage existing infrastructure and take advantage of existing amenities."
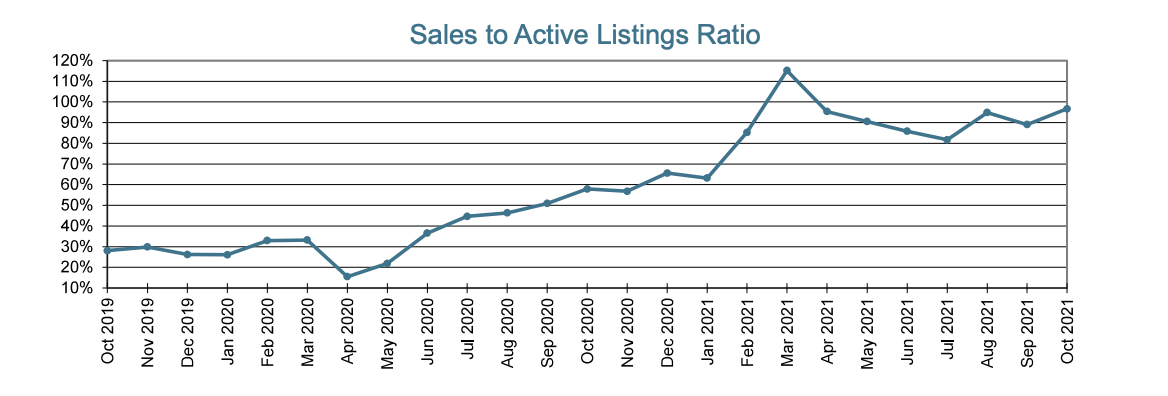
This chart tracks the ratio of total residential sales over total active residential listings at month-end for each of the last 25 months. The active listing count and the sales count can be viewed as indicators of housing supply and demand respectively. Observing the ratio between them can thus help indicate a "buyers' market", where there is downward pressure on prices, and a "sellers' market", where there is upward pressure on prices.
below 10%, there is downward pressure on prices (buyers' market)
above 25%, there is upward pressure on prices (sellers' market)
in the 15-20% range, there is little pressure on prices either way


