The Victoria Real Estate Board has released their latest statistics for the month of August. The following is an excerpt from their press release.
A total of 478 properties sold in the Victoria Real Estate Board region this August, 42.5 per cent fewer than the 831 properties sold in August 2021 and a 6.3 per cent decrease from July 2022. Sales of condominiums were down 57.1 per cent from August 2021 with 148 units sold. Sales of single family homes decreased 30.3 per cent from August 2021 with 249 sold.
“August is typically one of the slower months for real estate in the Greater Victoria area and this year was no exception,” says Victoria Real Estate Board President Karen Dinnie-Smyth. “After two years of market conditions that favoured home sellers, sales have diminished in the past few months and inventory levels have been slowly increasing.”
There were 2,137 active listings for sale on the Victoria Real Estate Board Multiple Listing Service® at the end of August 2022, a decrease of 1.2 per cent compared to the previous month of July but a 90.8 per cent increase from the 1,120 active listings for sale at the end of August 2021.
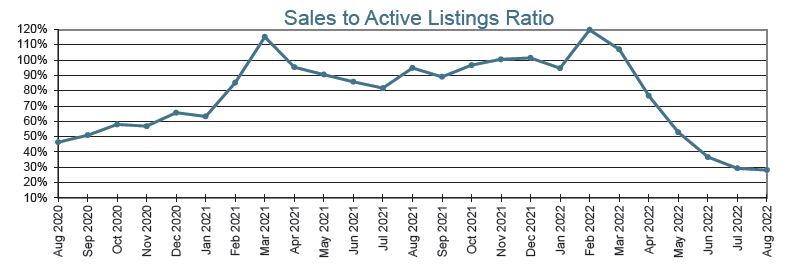
“One of the metrics we watch when we look at the market is the sales to active listings ratio – this is the percentage of available listings that have sold over the course of the month, which helps indicate the balance of supply and demand,” adds President Dinnie-Smyth. “A high percentage means more of the available listings have sold, which shows a high buyer demand and that’s generally a favourable market for sellers. The lower the percentage, the more properties available. In general, we look at the 15 to 20 per cent range as a balanced market. Right now, the ratio is 28.14 per cent, while at this time in 2021 we were at 94.91 per cent. We continue to trend towards a more balanced market. As conditions change, connect with your trusted REALTOR® to understand how your selling and buying plans fit into the current market.”
The Multiple Listing Service® Home Price Index benchmark value for a single family home in the Victoria Core in August 2021 was $1,201,400. The benchmark value for the same home in August 2022 increased by 15.8 per cent to $1,391,700 but was down 2.9 per cent from July's value of $1,433,400. The MLS® HPI benchmark value for a condominium in the Victoria Core area in August 2021 was $509,000, while the benchmark value for the same condominium in August 2022 increased by 22.2 per cent to $621,900, down by 2.8 per cent from the July value of $639,900
This chart tracks the ratio of total residential sales over total active residential listings at month-end for each of the last 25 months. The active listing count and the sales count can be viewed as indicators of housing supply and demand respectively. Observing the ratio between them can thus help indicate a "buyers' market", where there is downward pressure on prices, and a "sellers' market", where there is upward pressure on prices.
below 10%, there is downward pressure on prices (buyers' market)
above 25%, there is upward pressure on prices (sellers' market)
in the 15-20% range, there is little pressure on prices either way


