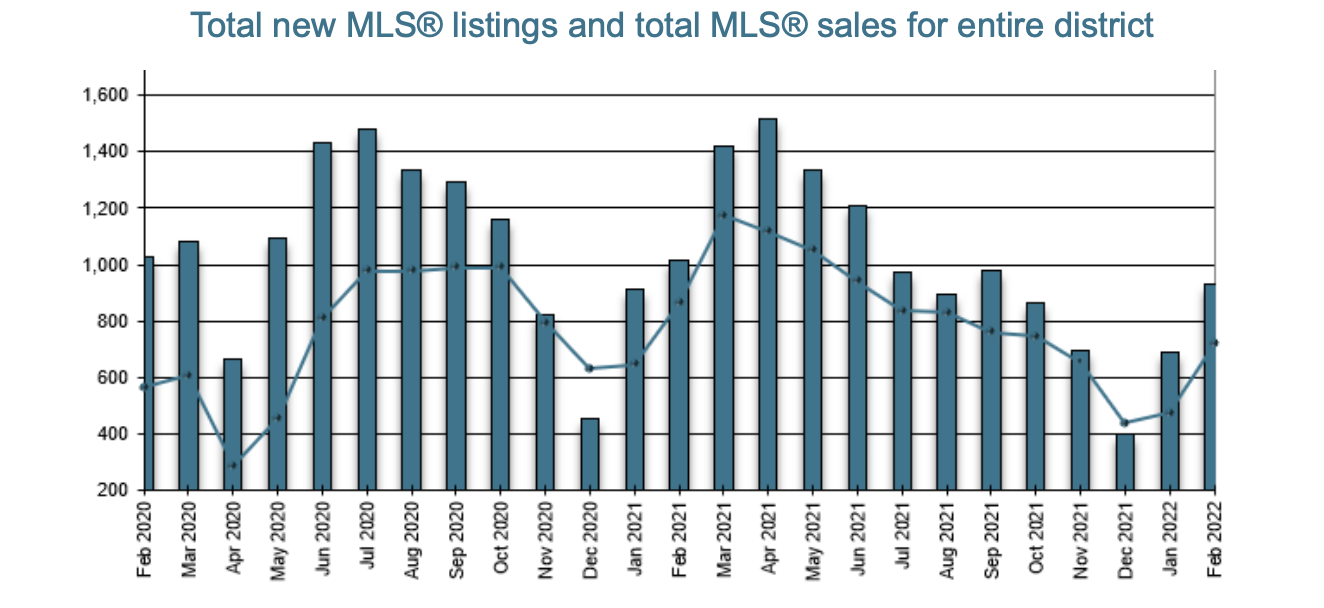
The Victoria Real Estate Board has released their latest statistics for the month of February. The following is an excerpt from their press release.
A total of 718 properties sold in the Victoria Real Estate Board region this February, 16.8 per cent fewer than the 863 properties sold in February 2021 but a 51.5 per cent increase from January 2021. Sales of condominiums were down 7.9 per cent from February 2021 with 267 units sold. Sales of single family homes decreased 20.8 per cent from February 2021 with 309 sold.
“It was heartening this month to see some more listings come to market in February,” said 2022 Victoria Real Estate Board President Karen Dinnie-Smyth. “However, inventory levels remain at record lows and without a strong government focus on increasing supply, buyers will continue to face escalating prices and difficult market conditions.”
There were 849 active listings for sale on the Victoria Real Estate Board Multiple Listing Service® at the end of February 2022, an increase of 14.1 per cent compared to the previous month of January but a 35.6 per cent decrease from the 1,318 active listings for sale at the end of February 2021
“We have asked the government for strong solutions to create supply to bring our market back into balance,” adds President Dinnie-Smyth. “We need incentives for gentle densification and the removal of municipal barriers to development. What government has chosen to focus on instead is their announcement of a cooling-off period for residential sales this spring. They announced this measure with no industry consultation into how this may impact our housing market. The Victoria Real Estate Board and the British Columbia Real Estate Association have strongly recommended against a cooling-off period. Industry research shows that a cooling-off period will add volatility in both slow and pressurized market conditions. It provides no protection for home sellers and creates more risk and uncertainty for them when selling a home. Experienced and well-funded buyers will have an advantage over first-time buyers because a cooling-off period reduces negotiations to price alone. We have recommended alternative ideas for consumer protection – including the suggestion that a pre‐ sale offer period be introduced, which transcends market conditions and would better protect buyers and sellers while also mitigating the impact of pre-emptive offers. We hope our suggestions are taken seriously, they are a result of thorough research and consultation of hundreds of our local practitioners. Instead of discussing the British Columbia Real Estate Association’s recommendations yesterday, Finance Minister Selina Robinson chose to inform the public that REALTORS® have a vested interest in home prices. For Minister Robinson to suggest that Realtors are keeping prices high is a convenient excuse and a weak attempt to divert attention away from the real issue – supply. Realtors would prefer a balanced market with reasonable prices and plenty of housing supply to meet demand. Our Realtors’ only vested interest is in their clients and the more balanced our market is, the better we are able to serve the needs of buyers and sellers.”
The Multiple Listing Service® Home Price Index benchmark value for a single family home in the Victoria Core in February 2021 was $948,500. The benchmark value for the same home in February 2022 increased by 26.1 per cent to $1,196,300, up from January’s value of $1,161,500. The MLS® HPI benchmark value for a condominium in the Victoria Core area in February 2021 was $494,200, while the benchmark value for the same condominium in February 2022 increased by 22.1 per cent to $603,600, up from the January value of $587,300.
This chart tracks the ratio of total residential sales over total active residential listings at month-end for each of the last 25 months. The active listing count and the sales count can be viewed as indicators of housing supply and demand respectively. Observing the ratio between them can thus help indicate a "buyers' market", where there is downward pressure on prices, and a "sellers' market", where there is upward pressure on prices.
below 10%, there is downward pressure on prices (buyers' market)
above 25%, there is upward pressure on prices (sellers' market)
in the 15-20% range, there is little pressure on prices either way


